By Chinonso Anyaehie · October 26, 2026
Why your survey is missing half the story
Ask people why they adopted an app, and they will give you tidy, sensible reasons. Watch their eyes, heart and brain while they use it, and you often see something else: hesitation they never mention, stress they don’t notice, attention that drifts to the wrong button.
That gap between what people say and what their bodies do is the reason NeuroIS exists. NeuroIS is a branch of Information Systems (IS) research, the field that studies how people and organisations use technology. It borrows tools and ideas from neuroscience, the science of the brain and nervous system, to study how people design, use and are affected by technology.
You do not need a medical degree or a hospital scanner to get started. This guide walks through the nine tools that matter for NeuroIS, in plain language:
- what each tool measures
- how a study with it actually runs
- which IS questions it can answer
- which brands researchers use and where to buy them
It ends with where a newcomer should start and the mistakes to avoid.
Ten ideas to know before you start
You only need these ten ideas to follow the rest of this guide. Each one is explained with an everyday example.
| Idea | What it means | Everyday example |
|---|---|---|
| Information Systems (IS) | The study of how people and organisations use technology, and how technology changes them | Why one team embraces a new app and another ignores it |
| Neuron | A brain cell. Neurons pass messages to each other using tiny electrical pulses | Like people in a stadium passing a message along a row |
| Construct | The idea a study is trying to measure, which you can’t see directly | Trust, stress or attention: real, but you can’t hold them in your hand |
| Self-report | Asking people to describe their own thoughts or feelings, usually in a survey | “On a scale of 1 to 7, how stressed do you feel?” |
| Signal | Anything a tool records from the body: voltage, sweat, heartbeats, gaze | The beeping line on a hospital heart monitor |
| Arousal | How strongly the body is reacting, whether the feeling is good or bad | Your heart pounds both on a rollercoaster and in a near-miss car accident |
| Valence | Which way a feeling goes: positive or negative | The difference between the rollercoaster (fun) and the near-miss (fear) |
| Baseline | A person’s normal, resting level, recorded before the task | Knowing your resting heart rate before you judge whether a run raised it |
| Noise | Recorded signal that has nothing to do with what you’re studying | A blink or a cough showing up in a brain recording |
| “When” versus “where” | Some tools show when a reaction happens to the millisecond; others show where in the brain it happens. No single tool does both well | A stopwatch tells you when; a map tells you where |
The one idea that ties them together: NeuroIS measures signals from the body to learn about constructs that people can’t fully describe in a self-report.
Where NeuroIS came from
NeuroIS was named in 2007 and given its first agenda in 2009. That September, fifteen scholars met at a small retreat in Gmunden, Austria. They published their conclusions as Riedl et al. (2010), “On the Foundations of NeuroIS,” in Communications of the Association for Information Systems.
The group included Fred Davis, who created the Technology Acceptance Model (TAM). TAM is one of the most-used theories in IS. It says people adopt a technology when they believe it is useful and easy to use. Neuroscientists and engineers who build brain-computer interfaces (systems controlled by brain signals) also took part. Their core argument still frames the field:
- IS should borrow from neuroscience, just as it already borrows from psychology and economics.
- Brain and body data add to surveys and experiments; they do not replace them.
- The biggest payoff is measuring what people cannot report. TAM assumes people decide to adopt technology by thinking it through consciously. But neuroscience shows that most brain activity is fast and automatic, happening without our awareness, like catching a ball without thinking. The authors suggested this may be why TAM research had stalled.
- You can do NeuroIS without a scanner, by using existing neuroscience findings to design and interpret ordinary studies.
The 2010 paper listed the tools available at the time. Some of them turned out to be central to IS research. Others are almost never used. Two tools the paper did not mention, eye tracking and hormone measures, have since become staples. This guide reflects that later picture.
Four questions to ask before you pick a tool
Every tool trades something away. Before choosing one, answer these four questions.
- What exactly do I want to measure? Start from the construct, the idea you want to measure, such as mental effort, stress, trust or attention. Then pick the tool that captures it. Starting from the device you happen to have access to is how weak NeuroIS papers get written.
- Do I need to know when something happens, or where in the brain? This is the central trade-off.
- Tools like EEG and eye tracking capture reactions to the millisecond, but say little about location.
- fMRI pinpoints location to within millimetres, but only every few seconds.
- How natural does the setting need to be? A wristband lets people work at their own desk. An fMRI scanner means lying still in a loud tube, pressing buttons. The more artificial the setting, the harder it is to claim your result reflects real technology use.
- What can I afford, in money and in time? Some tools cost under $200 and take minutes to set up. Others cost tens of thousands of dollars, or hundreds per participant-hour, and need specialist training. Cheap tools are not second-rate. Much of the published NeuroIS work relies on them.
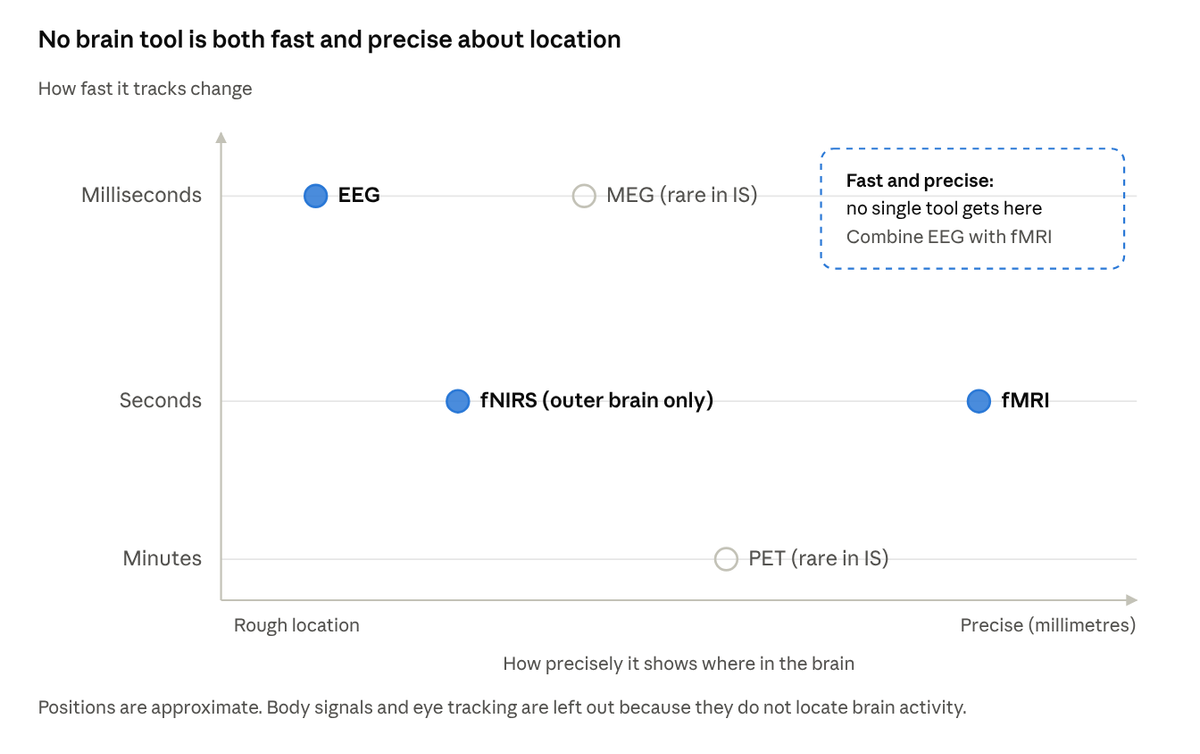
The when-versus-where trade-off for brain tools
EEG catches reactions as they happen but blurs location; fMRI pinpoints location but lags by seconds. That is why the founding paper recommends combining tools.
A useful habit: pair a tool that measures how strong a reaction is with one that measures which direction it goes. Sweat tells you someone is aroused, but not whether they are delighted or annoyed. Facial muscles or expressions fill that gap.
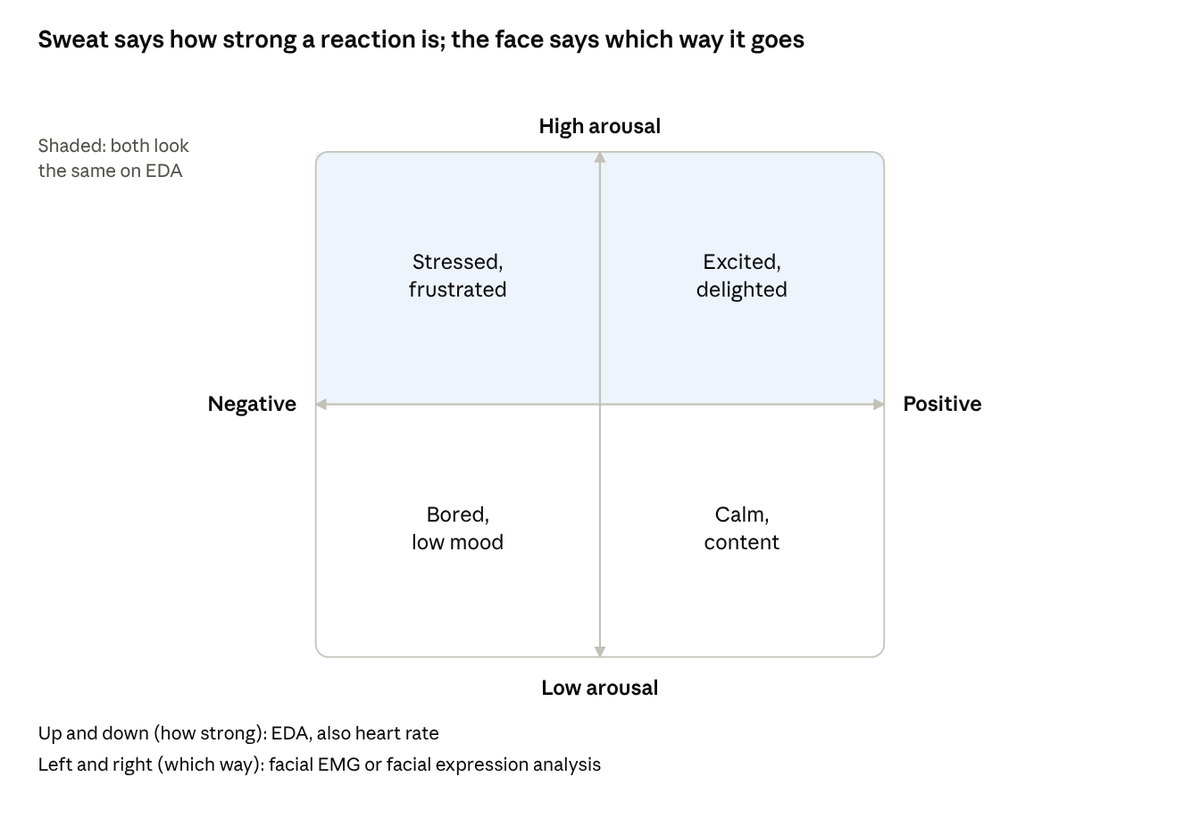
Why to pair tools · arousal versus valence
A delighted user and a frustrated user can produce the same sweat spike. Adding a measure of direction tells them apart.
The nine NeuroIS tools
Each tool below is described the same way: what it measures, how a study with it runs, the constructs it can capture, an example question from IS research, and the brands researchers buy. Body signals and eye tracking are where most newcomers should start. Brain measures come next. Scanners and hormone tests are specialist add-ons.
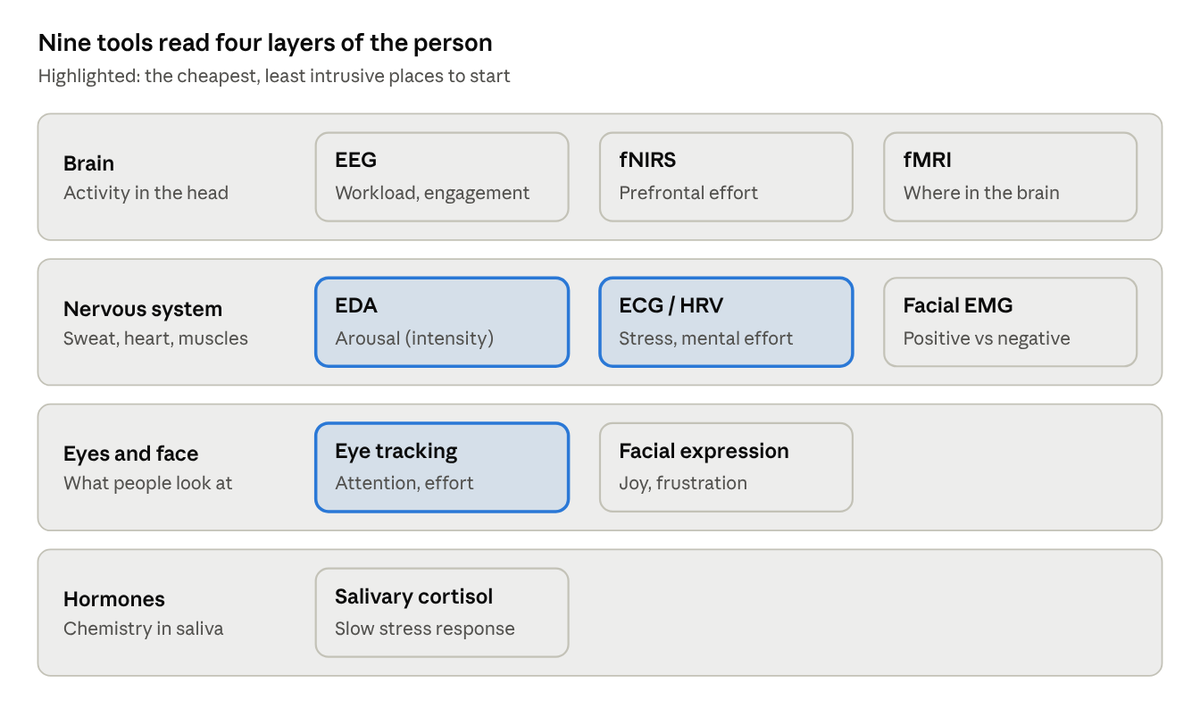
The NeuroIS toolkit · nine tools across four layers
Each row is a layer of the person a tool reads; each box names the tool and the construct it is best at.
1. Eye tracking
What it measures: where people look, for how long, in what order, and how much their pupils widen.
How a study runs: a small infrared camera sits under the monitor, or the participant wears tracking glasses. After a 30-second calibration (following a dot with the eyes), the participant uses a website or app as normal. You define “areas of interest,” such as a price, a warning or a button, and compare how attention lands on them.
Constructs: visual attention, how people search for information, which parts of a screen are noticed or ignored, reading behaviour, and mental effort (pupils widen as people think harder).
IS example: do people actually read privacy notices or security warnings, or do their eyes skip straight to “Accept”?
Brands:
- Tobii Pro (Spectrum, Fusion; Glasses 3 for wearable studies): the common choice for screen-based IS research. About €12,000–19,000 for Fusion and €20,000–35,000 for Spectrum, depending on speed; Glasses 3 is priced on quote
- SR Research EyeLink 1000 Plus: the precision standard for lab work, about €30,000
- Gazepoint GP3 HD: the budget option, good for teaching and pilot studies. The GP3 HD falls in the $1,000–10,000 range; the basic 60 Hz GP3 costs under $1,000
2. EEG (electroencephalography)
What EEG actually is
Your brain cells (neurons) communicate with tiny electrical pulses. One neuron’s signal is far too weak to detect from outside the head. But when millions of neurons near the surface of the brain fire in step, their combined voltage spreads through the skull to the scalp. EEG places electrodes on the scalp and records that voltage, thousands of times per second. Hans Berger recorded the first human EEG in 1924, so it is one of the oldest brain-measurement methods in use.
A useful comparison: EEG is like standing outside a football stadium with a microphone. You hear the instant the crowd roars, and how loud it is, but you can’t tell which seats the noise came from. That is EEG’s trade-off. Its timing is excellent, to the millisecond, but its sense of location is poor. Many different patterns of activity inside the brain can produce the same reading on the scalp, which is why it cannot pinpoint where a signal began.
Researchers read EEG in two main ways:
- Event-related potentials (ERPs): the brain’s response to a specific event, such as an error message appearing, averaged over many repetitions so the random noise cancels out.
- Brain rhythms (“brain waves”): ongoing oscillations, grouped into frequency bands.
| Band | Speed (cycles per second) | Often linked with |
|---|---|---|
| Delta | 0.5–4 Hz | Deep sleep |
| Theta | 4–8 Hz | Drowsiness; rises with working-memory load |
| Alpha | 8–13 Hz | Relaxed wakefulness; drops when attention is engaged |
| Beta | 13–30 Hz | Active thinking, alertness |
| Gamma | Above 30 Hz | Intense, high-level processing |
Two cautions for beginners. First, blinks, jaw clenches and head movements create electrical noise far larger than brain signals, so cleaning the data is a big part of the work. Second, the links in this table are tendencies, not one-to-one meanings.
What it measures: the tiny electrical signals produced when large groups of brain cells fire together, picked up through the scalp.
How a study runs: the participant wears a cap fitted with electrodes, often with a conductive gel. They do a task while the signal is recorded. You either average the brain’s response to repeated events (for example, each time an error message appears), or track rhythms such as alpha waves over time. Setup takes 15 to 45 minutes depending on the system.
Constructs: mental workload (how hard the brain is working), attention and engagement, whether someone is drawn toward or pulled away from something, the brain noticing an error, and reactions to specific events on screen.
IS example: does a cluttered dashboard raise mental workload compared with a simpler design, even when users rate both as “fine”?
Brands:
- Research grade, from roughly $1,000–25,000 for wireless or small systems (LiveAmp, g.tec nautilus, 16-channel BioSemi, ANT Neuro eego) to over $25,000 for full lab systems with 64 or more channels (actiCHamp, larger BioSemi and ANT setups): Brain Products (actiCHamp Plus in the lab, LiveAmp for wireless), BioSemi, g.tec, ANT Neuro
- Budget: Emotiv EPOC X and OpenBCI. Fine for workload and engagement; too imprecise for studies that depend on exact millisecond timing. The EPOC X costs $1,199, and full software features need a paid EmotivPRO subscription. OpenBCI’s 8-channel Cyton board costs $1,249, before electrodes and headwear.
3. Electrodermal activity (EDA), also called skin conductance
What it measures: small changes in sweat on the fingers or palm. When something excites or alarms you, your body releases a little sweat, often too little to feel. That sweat makes the skin conduct electricity better, and the sensor detects the change.
How a study runs: two electrodes attach to the fingers or palm, or a wristband sits on the wrist. You record a few minutes of rest as a baseline, then the task. You then look for sudden peaks after specific events, as well as the overall level.
Constructs: arousal, meaning how strongly someone is reacting, a bit like a volume dial. It rises when people are excited, stressed, surprised or alarmed, and stays low when they are calm or bored. What EDA cannot tell you is whether the reaction is positive or negative. A user delighted by a new feature and a user furious at a crash can produce exactly the same sweat spike. To know which one you are seeing, pair EDA with a tool that measures direction, such as facial EMG or facial expression analysis. The diagram on pairing tools, earlier in this guide, shows this.
IS example: do pop-up interruptions or system crashes produce measurable stress, even in people who say they don’t mind them? This is technostress research.
Brands:
- Shimmer3 GSR+: wearable, and widely used in behavioural labs. About €650 per sensor, or ready-made kits from $950 (one sensor) to $10,900 (fifteen sensors)
- BIOPAC MP160: the lab gold standard, priced on quote at the premium end
- Movisens and PLUX: solid alternatives. PLUX’s EDA sensor lists at €175, but it needs a separate hub
- Note that the popular Empatica E4 wristband has been phased out, so older papers cite a device you can no longer buy
4. ECG and heart-rate variability
What it measures: each heartbeat, and the tiny variations in time between beats. A healthy, relaxed heart does not beat like a metronome; the gaps between beats vary slightly. Under stress, that variation shrinks.
How a study runs: chest electrodes or a chest strap record the heart’s electrical signal. An optical sensor on the finger or wrist (PPG) is a cheaper but noisier substitute. Heart-rate variability needs at least a few minutes of clean recording to be meaningful.
Constructs: stress, mental effort, attention, and how well people manage their emotions. Less variation between beats (lower heart-rate variability) generally means more stress or effort.
IS example: do people working with an AI assistant show less physiological strain than those doing the same task alone?
Brands:
- Research grade: BIOPAC or Shimmer, often bundled with EDA and priced on quote
- Budget: the Polar H10 chest strap, which retails for about $90 and records beat-to-beat intervals well enough for many studies
5. Facial EMG (electromyography)
What it measures: electrical activity in specific facial muscles. The “smile” muscle (zygomaticus) is linked to positive feeling, and the “frown” muscle (corrugator) to negative feeling. It picks up muscle activity too small to see.
How a study runs: small electrodes sit above the eyebrow and on the cheek. You compare muscle activity while people react to designs, messages or system responses.
Constructs: emotional valence, meaning positive versus negative. That is exactly what EDA lacks, which is why the two are often recorded together.
IS example: does a chatbot’s tone produce a subtle frown that users never report?
Brands: BIOPAC is the usual choice. Shimmer’s ECG/EMG unit is a wearable alternative. Both are priced on quote.
6. Facial expression analysis
What it measures: facial expressions, classified frame by frame by software from ordinary webcam video.
How a study runs: record the participant’s face while they use the system. Software scores expressions such as joy, confusion or frustration over time, and you line those scores up with what was on screen.
Constructs: enjoyment, frustration and confusion with an interface, and engagement with content.
IS example: at which step of an online checkout do faces show confusion?
Brands:
- iMotions with its AFFDEX module (iMotions is now owned by Smart Eye)
- Noldus FaceReader
Caution: whether facial expressions reliably reveal inner emotion is scientifically contested. Treat this as a supporting measure, not your main evidence. Both iMotions and FaceReader are software licences priced on quote; add a good webcam to the budget.
7. fNIRS (functional near-infrared spectroscopy)
What fNIRS actually is
fNIRS is a headband or soft cap that uses harmless light to watch blood flow in the outer layer of the brain. It works on the same idea as fMRI: when a brain area works harder, oxygen-rich blood rushes to it. But instead of a giant magnet, fNIRS uses light.
Try this: shine a torch through your fingers in a dark room, and they glow red. Near-infrared light, just beyond the red you can see, passes through skin and bone even more easily. An fNIRS device uses this in four steps:
- Small light sources on the cap shine near-infrared light into the head.
- The light travels a few centimetres in, through the scalp and skull into the surface of the brain, and some of it bounces back out.
- Small detectors a few centimetres away catch the light that comes back. Each source-detector pair is called a channel.
- Oxygen-rich and oxygen-poor blood absorb this light differently. So the amount of light that returns shows how oxygen levels change in the brain tissue underneath.
Compared with fMRI, fNIRS is portable, quiet, much cheaper, and tolerates movement, so people can sit at a normal desk or even walk. The trade-off is that it only reaches the brain’s outer surface, not deep structures. Thick or dark hair can block the light, and changes in blood flow in the scalp can blur the signal. Like fMRI, it responds over seconds, not milliseconds.
What it measures: changes in blood oxygen in the outer layer of the brain, detected by shining harmless near-infrared light through the skull.
How a study runs: the participant wears a headband or cap of light sources and detectors, usually over the forehead. Because it tolerates movement far better than fMRI, people can sit at a normal desk, talk, or even walk.
Constructs: mental workload and decision effort in the prefrontal cortex, the area just behind the forehead that handles planning, focus and self-control. It also shows how engaged people are with a task in realistic settings.
IS example: does switching between many apps and notifications tax the prefrontal cortex more than focused work?
Brands: NIRx NIRSport 2 and Artinis (Brite, or OctaMon for forehead-only studies). Prices depend mostly on how many channels the system has: from about €10,000 for a small forehead device to well over €200,000 for a large whole-head system. Both makers sell on quote.
8. fMRI (functional magnetic resonance imaging)
What fMRI actually is
An MRI scanner is a very strong magnet, typically 1.5 to 3 Tesla, tens of thousands of times stronger than Earth’s magnetic field. It uses radio waves to build detailed pictures of the inside of the body. A standard MRI shows structure, like a photograph of the brain. Functional MRI takes a rapid series of pictures to show activity changing over time.
fMRI does not measure brain cells directly. It measures blood:
- When a brain region works harder, its neurons use more energy.
- The body responds by sending extra oxygen-rich blood to that region, more than it actually needs.
- Oxygen-rich and oxygen-poor blood behave differently in a magnetic field.
- The scanner picks up that difference, called the BOLD signal (blood-oxygen-level-dependent).
A useful comparison: fMRI is like working out which shops are busy by watching where the delivery trucks go. You can map the city precisely, but the trucks arrive several seconds after the rush begins. The blood response peaks about 4 to 6 seconds after the neurons fire. That is why fMRI is excellent at where, to a few millimetres, and slow at when.
The colourful “blobs” in fMRI images are not photographs of thought. They are statistical maps. They show where the BOLD signal differed between two conditions, such as viewing a trustworthy versus an untrustworthy online offer, across many trials and participants. The brain is divided into tiny cubes called voxels, each a few millimetres wide, and each cube is tested.
fMRI uses no radiation and is considered safe. But anyone with metal implants, some medical devices, or severe claustrophobia usually cannot take part, and participants must lie still in a loud, narrow tube.
What it measures: changes in blood oxygen across the whole brain, including deep structures. This shows which regions are active, to within millimetres.
How a study runs: you don’t buy a scanner. You book time at a university or hospital imaging centre, usually charged by the hour, and work with its staff. Participants lie still in the scanner, view the screen through a mirror, and answer with button boxes.
Constructs: questions where location is the point, because different regions signal different processes.
IS examples:
- Trust and distrust turned out to involve different brain regions, so they are not simply opposite ends of one scale.
- The brain’s response to security warnings fades with repetition, which helps explain why people stop noticing them.
Where to get it: ask your university’s imaging centre about rates and training. Most require a short safety and operator course. For a sense of cost, the University of Michigan’s centre charges $685 per scan hour (from August 2026). A study of 20 participants at about an hour each would cost roughly $14,000 in scan time alone.
9. Hormones (salivary cortisol)
What it measures: cortisol, the body’s main stress hormone, collected from saliva.
How a study runs: participants give saliva samples before the task and at set intervals after it. Cortisol peaks roughly 20 to 30 minutes after a stressor. Samples are frozen and tested by a lab. Time of day matters a lot, because cortisol naturally falls across the day.
Constructs: physiological stress, especially technostress.
IS example: a sudden system breakdown during a task can raise users’ cortisol, showing that technostress is a physical response and not only a feeling.
Suppliers: Salimetrics for testing kits, and Sarstedt Salivette tubes for collecting saliva. Many universities have a lab that runs the tests for you. A 2016 Salimetrics price example worked out to about €8 per sample, with testing included; collection tubes are extra. Prices will have risen since.
The nine tools at a glance
Eye tracking, EDA and heart rate are the cheapest and most natural entry points. fMRI and cortisol answer narrower questions at higher cost.
| Tool | Measures | What it tells you | Timing | Setting | Rough cost | Starter brand |
|---|---|---|---|---|---|---|
| Eye tracking | Gaze, pupil size | Attention, search, cognitive load | Milliseconds | Normal desk | Low to high | Tobii; Gazepoint (budget) |
| EEG | Brain electrical activity | Workload, engagement, error detection | Milliseconds | Desk, wearing a cap | Low to high | Brain Products; Emotiv (budget) |
| EDA | Sweat on skin | Arousal, stress | 1–3 seconds | Normal desk or wearable | Low | Shimmer3 GSR+ |
| ECG / HRV | Heartbeats | Stress, mental effort | Seconds to minutes | Normal desk or wearable | Very low to low | Polar H10; BIOPAC |
| Facial EMG | Facial muscle activity | Positive vs negative emotion | Milliseconds | Desk, sensors on face | Medium | BIOPAC |
| Facial expression | Expressions via webcam | Enjoyment, frustration | Video frame rate | Normal desk | Medium (software licence) | iMotions; Noldus FaceReader |
| fNIRS | Blood oxygen, outer brain | Prefrontal workload, effort | Seconds | Desk, wearing a headband | High | NIRx; Artinis |
| fMRI | Blood oxygen, whole brain | Where processes happen (trust, habituation) | Seconds | Scanner | Per hour, at an imaging centre | University imaging centre |
| Salivary cortisol | Stress hormone | Physiological stress | 20–30 minutes | Any | Low per sample | Salimetrics kits |
Cost tiers are approximate: very low means under about $200, low is hundreds to a few thousand dollars, medium is several thousand, and high is tens of thousands. Research equipment is almost always sold by quote, and academic discounts are common, so ask vendors directly. Each tool’s section above lists the specific prices found. They are shown in the currency each source used (US dollars or euros), exclude tax and shipping, and were checked in October 2026.
Which tool for which IS construct
The table above starts from the tools. Researchers usually start from the other end: they know the construct they want to measure and need the right tool for it. This table maps common IS constructs to the tools that capture them best.
| IS construct | What it means in plain words | Best tools | What the tool picks up |
|---|---|---|---|
| Cognitive load (linked to perceived ease of use) | How hard someone has to think to use a system | Eye tracking, EEG, fNIRS, heart-rate variability | Pupils widen; EEG rhythms shift; the forehead area gets more oxygen; heartbeat variation drops |
| Attention and information search | What people notice, read or skip on a screen | Eye tracking, EEG | Where the eyes go and for how long; brain responses to specific screen events |
| Trust and distrust | Willingness to rely on a website, seller or AI system | fMRI, EEG, EDA | Distinct brain areas for trust and distrust; arousal when something seems risky |
| Technostress | Stress caused by technology: overload, crashes, constant connection | EDA, ECG/heart-rate variability, cortisol | Sweat spikes; reduced heartbeat variation; a stress-hormone rise |
| Emotion: enjoyment, frustration, satisfaction | How a person feels while using a system | Facial EMG or facial expression, plus EDA | Smile or frown muscles show direction; sweat shows strength |
| Engagement and flow | Being absorbed in a task or app | EEG, EDA, eye tracking, heart rate | Steady attention patterns; sustained moderate arousal |
| Habituation to security warnings | People stop noticing warnings they see often | fMRI, eye tracking | The brain’s response fades with repeats; eyes spend less time on the warning |
| Risk and uncertainty in online decisions | Feeling unsure or exposed when buying or sharing data | fMRI, EDA | Brain areas tied to risk and ambiguity; arousal before a risky choice |
| Interruptions and multitasking | The cost of switching between apps and alerts | EDA, heart-rate variability, fNIRS, EEG | Stress responses and extra mental effort after each switch |
| Interface usability | Whether a design is easy and pleasant to use | Eye tracking plus facial expression | Confused searching; frustrated expressions at specific steps |
For a fuller, research-grade mapping, read Dimoka et al. (2012) in MIS Quarterly, listed in Further reading.
Tools you will read about but probably won’t use
The 2010 founding paper also listed six tools that rarely appear in IS research. You will meet them in the literature, so it helps to know why they are on the sidelines.
| Tool | What it does | Why IS researchers rarely use it |
|---|---|---|
| PET | Tracks a mildly radioactive substance to see which brain areas use the most energy | Requires injecting a radioactive substance, so it is hard to justify for healthy participants |
| MEG | Measures magnetic fields from brain activity | Needs a shielded room and very expensive equipment; few sites exist |
| TMS | Uses magnetic pulses to briefly disrupt a brain region | Stimulates the brain rather than observing it, which raises ethical and safety bars |
| Lesion mapping | Studies patients with brain damage | Requires access to clinical patients through hospitals |
| VBM | Compares the size of brain areas (grey matter, where most neurons sit) between people | Measures brain structure, not reactions to technology |
| DTI | Maps the brain’s wiring: the cable-like connections (white matter) between areas | Also structural; useful for individual differences, not for momentary experience |
These tools matter in neuroscience. For questions about how people react to technology, the nine tools above do the work.
Where to start if you’re new
Start small and cheap. Run one well-designed study with one or two tools before touching anything expensive.
- Read before you buy. Start with Riedl et al. (2010) for the origins. Then read Dimoka et al. (2012) in MIS Quarterly for how each tool maps to IS constructs. Riedl and Léger’s textbook Fundamentals of NeuroIS (2016) is the most complete single introduction.
- Check what your department already owns. Many business schools, psychology departments and HCI labs already have eye trackers, EEG caps or physiological sensors sitting in a cupboard. Borrowing beats buying.
- Begin with one of three starter combinations:
- Eye tracking + EDA: what people look at, and how strongly they react
- EDA + facial EMG (or facial expression): how strong a reaction is, and whether it is positive or negative
- ECG/HRV + a short questionnaire: physiological stress compared with self-reported stress
- Always keep the survey. The most persuasive NeuroIS findings compare brain or body data with self-reports, and show where they agree and where they diverge.
- Pilot everything. Run three to five pilot participants to find bad electrode contact, timing errors and confusing instructions before your real sample.
A simple NeuroIS study, start to finish
Here is what a first study could look like. It is an invented example, to show the pieces working together.
The question: Does a cluttered online checkout page stress shoppers more than a clean one, even when they say both are fine?
The tools: an eye tracker, to see where people look, and an EDA sensor on two fingers, to see how strongly they react. Plus a short questionnaire.
- Prepare. Build two versions of the checkout page, cluttered and clean, that are identical except for the clutter. Get ethics approval. Work out how many participants you need, say 40.
- Welcome and set up. Explain the study, get consent, attach the EDA electrodes and calibrate the eye tracker. This takes about 10 minutes.
- Record a baseline. The participant sits quietly for 3 minutes so you know their normal sweat level.
- Run the task. The participant completes a purchase on each page version. Half see the cluttered page first and half see the clean one first, so tiredness or practice doesn’t favour either version.
- Ask. After each page, they answer a few questions: “How stressful was this checkout?” and “How easy was it?”
- Analyse. Compare sweat peaks and gaze patterns between the two pages, each person against their own baseline. Then compare the body data with the questionnaire answers.
What you might learn: people may rate both pages as easy, while their EDA shows more stress spikes on the cluttered page, and the eye tracker shows their gaze bouncing between distractions before finding the “Pay” button. That gap between what people said and what their bodies did is the kind of finding NeuroIS is built for.
Free software that does most of the work
Commercial platforms such as iMotions record and sync many devices in one interface, which saves time but costs a licence. A free toolchain covers the same ground:
- PsychoPy: builds and runs the experiment (stimuli, timing, responses)
- Lab Streaming Layer (LSL): synchronises data streams from different devices onto one clock
- MNE-Python or EEGLAB: EEG cleaning and analysis
- NeuroKit2: a Python package for EDA, ECG and other body signals
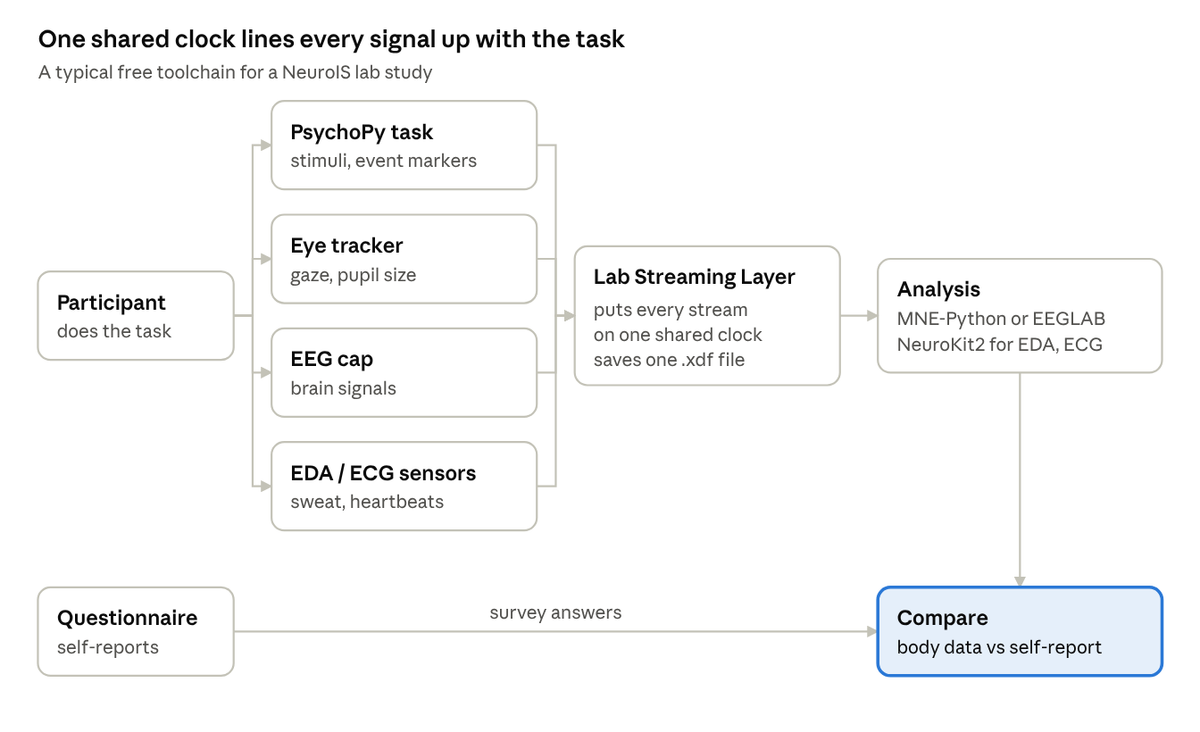
A free NeuroIS study pipeline · from task to comparison
The shared clock is what lets you say a pupil widened or a sweat spike began at the exact moment an error message appeared.
Five mistakes to avoid
1. Reading the mind from one signal. A brain area lighting up, or a spike in sweat, does not prove a specific feeling. The amygdala, a small almond-shaped area deep in the brain, responds to fear. But it also responds to surprise and to anything new. So seeing it active does not mean the person is afraid. Neuroscientists call this mistake “reverse inference”: reasoning backwards from a signal to a single feeling. Tie every signal to a clear theory and a controlled comparison, and avoid claims like “the brain shows users trust the site.”
2. Samples that are too small. Neuroscience studies have historically used small groups. The 2010 paper notes a typical size of about 18 participants. Small samples miss real effects and exaggerate the ones they find, the way flipping a coin five times can easily give four heads. Work out in advance how many participants you need to detect the effect you expect. When you can, pre-register: publicly record your plan and predictions before collecting data, so no one can say you changed them after seeing the results.
3. Forgetting that the lab is artificial. Electrodes, caps and scanners change how people behave. Choose the least intrusive tool that answers your question, and say plainly what your setting can and cannot tell readers about real-world use.
4. Skipping the baseline. Bodies differ: some people sweat more, and some have naturally higher heart rates. Record a rest period for each participant and compare against it, rather than comparing raw numbers between people.
5. Treating brain data as ordinary data. Neural and physiological recordings are sensitive personal information. Get proper ethics approval, explain to participants exactly what you record, store data securely, and have a plan for incidental findings: unexpected medical discoveries made by accident. If an fMRI scan reveals a possible abnormality, someone qualified must handle it. Also be careful about how your work could be used: the step from “measuring user experience” to “reading minds” is a short one in public perception, and the 2010 authors flagged this risk.
Further reading
Start here
- Riedl, R., Banker, R. D., Benbasat, I., Davis, F. D., Dennis, A. R., Dimoka, A., et al. (2010). On the foundations of NeuroIS: Reflections on the Gmunden Retreat 2009. Communications of the Association for Information Systems, 27, Article 15.
- Dimoka, A., Banker, R. D., Benbasat, I., Davis, F. D., Dennis, A. R., Gefen, D., et al. (2012). On the use of neurophysiological tools in IS research: Developing a research agenda for NeuroIS. MIS Quarterly, 36(3).
- Riedl, R., & Léger, P.-M. (2016). Fundamentals of NeuroIS: Information Systems and the Brain. Springer.
Studies mentioned in this guide
- Dimoka, A. (2010). What does the brain tell us about trust and distrust? Evidence from a functional neuroimaging study. MIS Quarterly, 34(2).
- Anderson, B. B., Vance, A., Kirwan, C. B., Eargle, D., & Jenkins, J. L. (2016). From warning to wallpaper: Why the brain habituates to security warnings and what can be done about it. Journal of Management Information Systems, 33(3).
- Riedl, R., Kindermann, H., Auinger, A., & Javor, A. (2012). Technostress from a neurobiological perspective: System breakdown increases the stress hormone cortisol in computer users. Business & Information Systems Engineering, 4(2).
On the pitfalls
- Poldrack, R. A. (2006). Can cognitive processes be inferred from neuroimaging data? Trends in Cognitive Sciences, 10(2).
- Button, K. S., et al. (2013). Power failure: Why small sample size undermines the reliability of neuroscience. Nature Reviews Neuroscience, 14.
- Barrett, L. F., Adolphs, R., Marsella, S., Martinez, A. M., & Pollak, S. D. (2019). Emotional expressions reconsidered: Challenges to inferring emotion from human facial movements. Psychological Science in the Public Interest, 20(1).
Product sources
Brand and product details were checked against these pages; follow the brand links in each tool section for current models and quotes.
- Empatica: E4 sunset notice
- University of Twente BMS Lab: E4 phase-out
- Research Live: Smart Eye acquires iMotions
- Brain Products: how to choose an EEG amplifier
- Brain Products: Tobii Pro Glasses 3
- NIRx: NIRSport
- Shimmer: GSR+ specification sheet
Price sources
- Leiden University research wiki: eye tracker comparison (2024 estimates)
- iMotions: eye tracker prices
- iMotions: EEG headset prices
- Emotiv: EPOC X price guide
- OpenBCI: Cyton 8-channel board
- iMotions: GSR device prices
- Shimmer: Consensys GSR development kits
- Polar H10 retail listing
- NeuroStars: fNIRS system costs discussion (2017)
- University of Michigan fMRI Laboratory: cost and billing
- Salimetrics: saliva testing cost example (2016)