
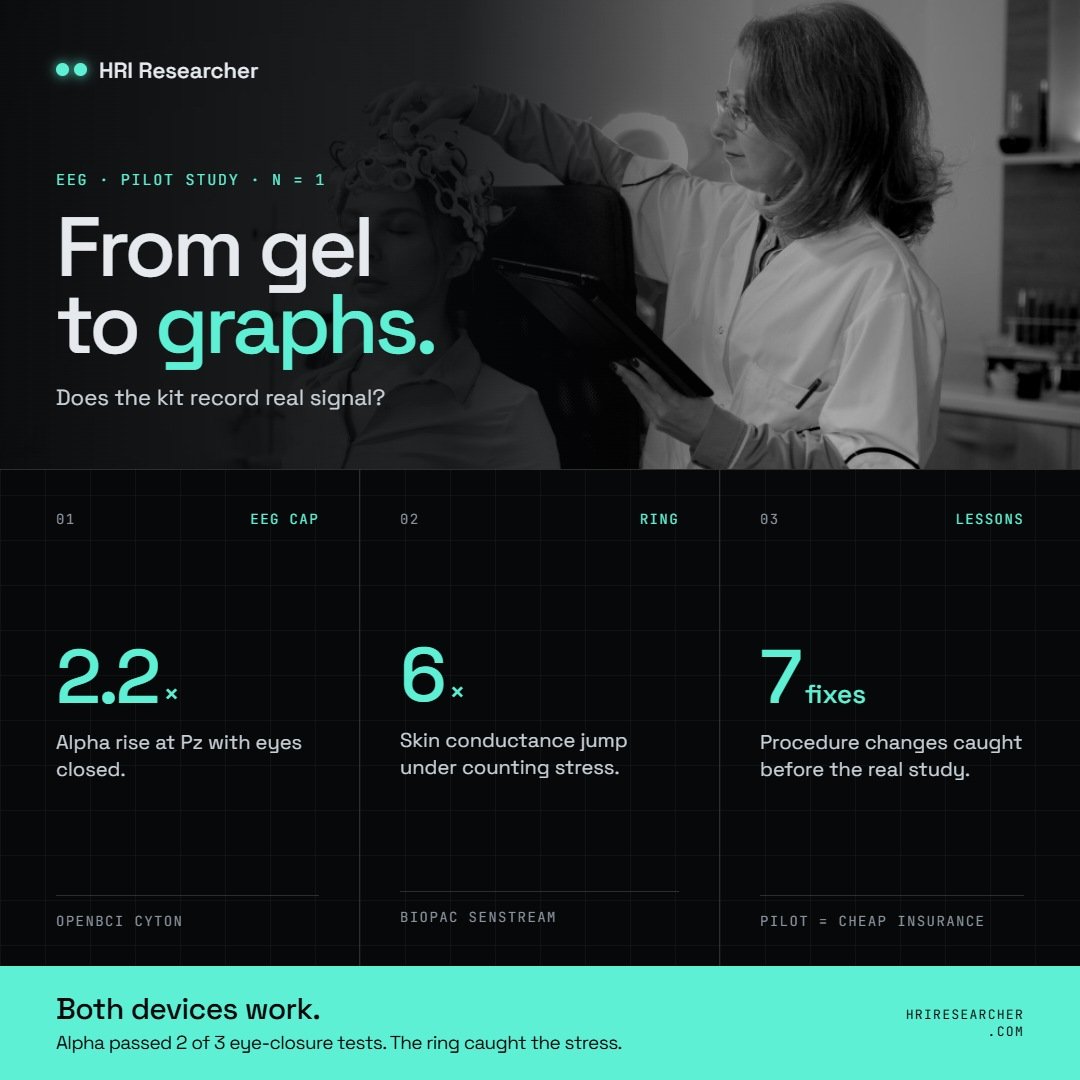
A one-participant pilot to check that an OpenBCI EEG cap and a Biopac Senstream ring record valid data, and what the data showed.
The setup
I used two devices, recorded separately:
- EEG: an OpenBCI Cyton board with a gel electrode cap, streaming into the OpenBCI GUI. EEG picks up the tiny electrical signals brain cells give off, through the scalp.
- Biopac Senstream ring: worn on a finger of the non-dominant hand (the one you don’t write with, because it moves less). It measures skin conductance (tiny amounts of sweat) and heart rate, which both rise when the body is stressed or startled.
I used seven electrodes plus ground and reference. Each electrode plugs into a bottom pin on the Cyton board and shows up as a numbered channel in the GUI.
| Electrode | Where on the head | GUI channel | Why it’s there |
| Fp1 | Forehead, left | 1 | Catches blinks |
| Fp2 | Forehead, right | 2 | Catches blinks |
| F3 | Front, left | 3 | Frontal activity |
| F4 | Front, right | 4 | Frontal activity |
| Pz | Top-back, middle | 5 | Alpha waves |
| O1 | Back, left | 6 | Alpha waves |
| O2 | Back, right | 7 | Alpha waves |
| GND | Cap’s ground spot | none (BIAS pin) | Ground |
| REF | Cap’s reference spot | none (SRB pin) | Reference |
The frontal electrodes catch blinks. The back-of-head electrodes catch alpha, a slow brain rhythm (8–12 waves per second) that gets much stronger when you close your eyes and relax. It is the easiest brain change to see, which makes it perfect for checking that an EEG works.
The pilot, step by step
Each step produces a change that is already known to happen. If the change shows up in the data, the equipment works. I pressed a marker at the start of each step so I could find it later in the recording.
EEG test (about 10 minutes of recording)
| Step | Time | What the participant did | What should show up |
| 1. Signal check | 1 min | Blink 5 times, clench jaw 5 times, look left then right | Big spikes on the forehead channels; bursts of fast noise on clenches |
| 2. Rest | 3 min | Look at a + on the screen and relax | Their normal level |
| 3–8. Eyes closed / open | 6 × 1 min | Closed, open, closed, open, closed, open | Alpha rises each time the eyes close, strongest at the back of the head |
Ring test (about 15 minutes)
| Step | Time | What the participant did | What should show up |
| Rest 1 | 3 min | Sit quietly | Steady baseline |
| Counting 1 | 3 min | Count backward out loud by 7s, as fast as possible, restarting after every mistake | Sweat and heart rate rise |
| Rest 2 | 3 min | Sit quietly | Values come back down |
| Counting 2 | 3 min | Same task again | Values rise again |
| Rest 3 + claps | 2 min | Sit quietly while I clap loudly 3 times at uneven gaps | A quick sweat bump 1–3 seconds after each clap |
The counting is not about the maths. Being rushed, corrected and restarted is what creates the mild stress.
Reading the data
I did not analyse the data by eye. The raw files were read with short Python scripts, which also drew the graphs. Then I checked the results against what I had seen on the live screen.
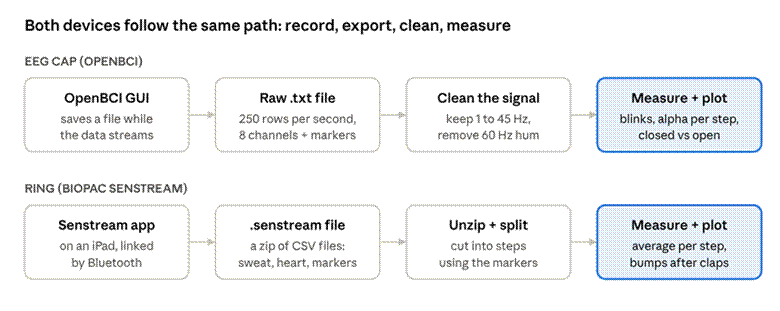
From recording to graphs: two devices, four stages
Both devices go through the same four stages. The marker I pressed at each step is what lets the files be cut into the right pieces.
| File | From | What’s inside |
| OpenBCI-RAW-….txt | OpenBCI GUI | One row per sample (250 per second): the 8 EEG channels, movement, a timestamp and a marker column. Plain text, but huge. |
| BrainFlow-RAW-….csv | OpenBCI GUI | The same data again in another format. I didn’t need it. |
| ….senstream | Senstream app | Really a zip file. Inside: skin conductance, heart rate, pulse, temperature, movement and the event markers, each as its own CSV. |
One surprise worth knowing: the OpenBCI GUI stamps the time once for each small batch of samples, not for every sample. Plotted against those timestamps, my first graph looked like a staircase. Rebuilding the time from the sample count (sample number ÷ 250) fixed it.
Result 1: the cap was picking up signal
The first minute of the EEG recording passed easily. Each action left its own fingerprint in the data.
Signal check: blinks, jaw clenches and eye movements on the forehead (Fp1) and back-of-head (Pz) channels
- 5 blinks: five clean, evenly spaced dips on the forehead channel, one per blink.
- Jaw clenches: bursts of fast fuzz. That’s muscle activity, which is much stronger than brain signals.
- Looking left and right: big slow swings. The eyes act like small batteries, so moving them shifts the voltage on nearby electrodes.
None of these are brain signals, but they prove the electrodes are touching skin and recording. At rest, the channels sat at a normal 10–17 µV, with none railed.
Result 2: alpha rose every time the eyes closed
This is the real test of an EEG: can it see a genuine brain change? The graph below tracks alpha strength over time, averaged over the three back-of-head electrodes (Pz, O1, O2). The shaded blocks are the eyes-closed minutes.
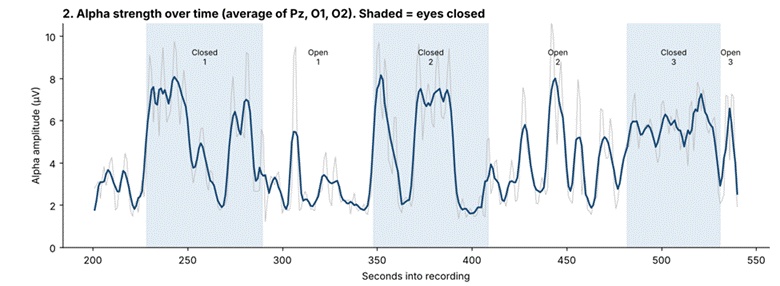
Alpha strength over time: it jumps up in each shaded eyes-closed block
Alpha jumps up in each shaded block and drops when the eyes open. To put a number on it, I divided alpha with eyes closed by alpha with eyes open for each pair of minutes. Above 1 means alpha went up.
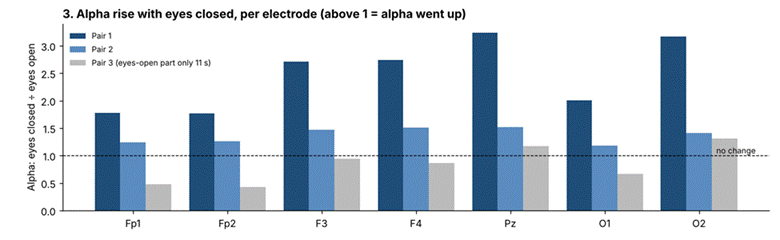
Eyes closed ÷ eyes open, per electrode, for the three pairs
| Pair | Alpha with eyes closed vs open | Verdict |
| 1 | 2–3× stronger, highest at Pz and O2 | Clear pass |
| 2 | About 1.5× stronger | Pass, but weaker (see below) |
| 3 | Can’t judge | I stopped recording 11 seconds into the last eyes-open minute |
That’s 2 out of 3, which met my success rule.
Detective work: an eye closure in the wrong minute
Why was pair 2 weaker? Alpha during the second eyes-open minute (step 6) kept spiking up to eyes-closed levels. It looked as if the participant had closed his eyes when he was meant to keep them open, and my notes from the session confirmed it happened in step 6.
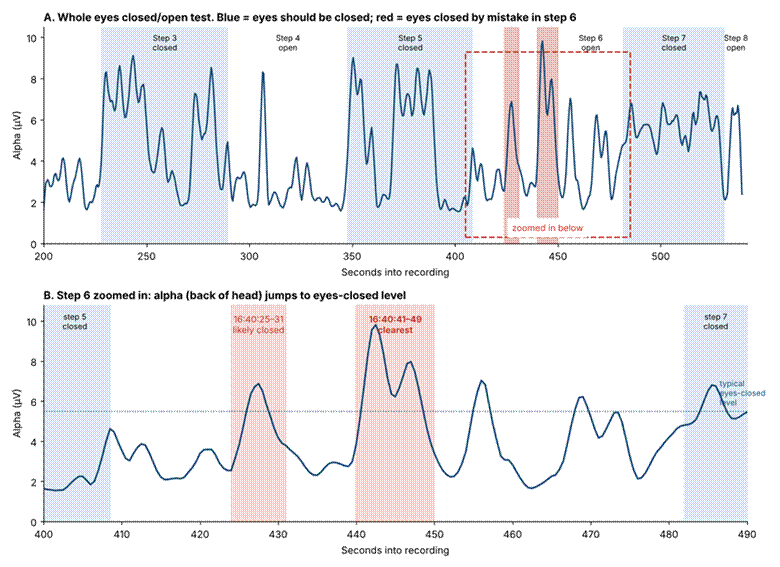
Step 6 zoomed in: alpha jumps to eyes-closed level at 16:40:25–31 and 16:40:41–49
The clearest moment was 16:40:41–16:40:49, when alpha rose even higher than in the real eyes-closed minutes. With those seconds left out, pair 2 jumped from about 1.5× to 2.2× at Pz, close to pair 1. So the equipment was fine; the participant briefly closed his eyes.
One caution: alpha can also rise with the eyes open when someone gets drowsy. Here the data and my notes agreed, but on its own a rise is a strong hint, not proof.
Bonus: the ring caught the stress too
The Biopac ring passed its main test. Skin conductance and heart rate rose during both counting tasks and came down during the rests.
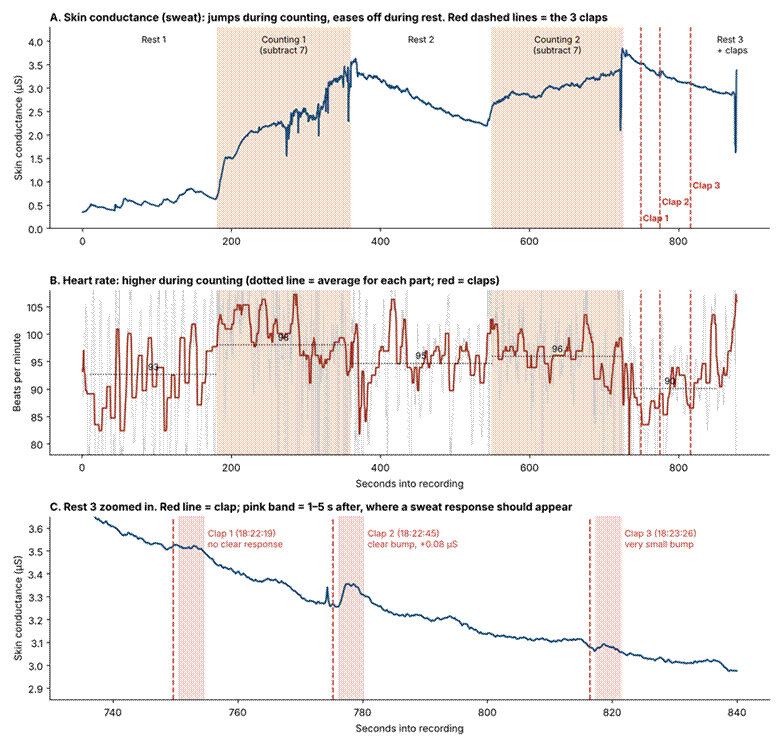
Ring results: skin conductance and heart rate across the session, with the three claps marked and zoomed in
| Part | Skin conductance (µS) | Average heart rate (bpm) |
| Rest 1 | Low, about 0.5 | 93 |
| Counting 1 | Jumped about 6×, to 3.2 | 98 |
| Rest 2 | Eased down, 3.4 → 2.3 | 95 |
| Counting 2 | Rose again, 2.7 → 3.3 | 96 |
| Rest 3 + claps | Eased down, 3.7 → 3.0 | 90 |
The claps only half worked: one clear sweat bump (clap 2, 2–3 seconds after the clap), one tiny bump and one no-show. The ring itself wasn’t the problem, since it reacted strongly to the counting. More likely, the participant was expecting the claps by then, and his sweat level was still coming down from the counting, which can hide small bumps.
The sharp downward spikes in the top panel are hand movements, mostly at the changeovers between steps. They’re not real changes in sweat.
What I’ll do differently in the real study
Both devices work. The pilot’s real value was in the small procedure fixes it turned up:
- Use the stable OpenBCI GUI, not the beta, so the impedance check is available. And double-check the GUI is in live mode, not Synthetic.
- Budget 30 minutes for gel, starting with ground, reference and the back of the head, where hair slows things down.
- Let the last block run its full minute before stopping the recording.
- Watch the participant’s eyes during the eyes-open minutes, and press an extra marker if they close.
- Don’t miss markers. Two EEG markers were missed and one ring marker was pressed twice. A printed checklist with tick boxes helps.
- Make the claps a real surprise: louder, out of sight, and only after the sweat level has settled from the last task.
- Keep chargers and power cables away from the board. The raw EEG had strong 60 Hz electrical hum. The filter removes it, but less hum means cleaner data.